
Application Performance Testing
Measuring the Right Things

Server-Side Performance
Performance, Reliability, and Efficiency
High-performance digital experiences start at the server. Our goal is to validate the timing, capacity, and scaling of your infrastructure and application code, ensuring your platform is ready for real-world demands.
Client-Side Performance
The True User Experience
Real-world performance is about more than just server response times—it’s about how your users perceive your application. Since web pages load asynchronously, factors like JavaScript execution, hardware, and connection speeds determine when a page feels "complete."


API Performance
Resilience at Scale
In a connected ecosystem, your APIs are the digital glue holding your services together. Our testing goes beyond simple "up or down" checks to measure how your endpoints handle high-concurrency traffic, ensuring that data exchange remains fast, consistent, and efficient, even under peak stress.
Our Performance Test Approach
A Typical Project Lifecycle.
Define the Problem
Identify the specific business risks and performance bottlenecks that need addressing to ensure the application meets user expectations. This phase establishes the "why" behind your testing efforts to focus resources effectively.
Planning
Outline the testing scope, tool selection, and environment requirements while aligning with stakeholders on the project timeline. A solid plan ensures that the infrastructure is ready to handle the simulated load without surprises.
Define and Gather Metrics
Establish clear Service Level Objectives (SLOs) such as response times, throughput, and error rates to measure success objectively. These benchmarks serve as the goalposts for every test execution that follows.
Write Scripts
Develop robust automated scripts that accurately mimic real-world user behavior and data variations. Clean scripting is the backbone of a simulation that actually reflects how the system will be used in production.
Baseline
Conduct initial tests under minimal load to determine the system's "normal" performance state. This provides a critical point of comparison for identifying regressions or improvements during high-traffic scenarios.
Reproduce Problems
Isolate and recreate identified performance issues in a controlled environment to verify their root causes. This step ensures that developers have a consistent scenario to test their fixes against.
Execute, Tune, Repeat
Run full-scale load tests and iteratively adjust system configurations or code to optimize performance. This cycle continues until the application consistently hits its predefined performance targets.
Evaluate and Document
Document the insights gained and establish a strategy for continuous performance monitoring in production. Summarizing the journey helps prevent future regressions and prepares the team for the next scale-up.
Establish Continuous Testing
To maintain the achieved performance level of the application, we recommend establishing a continuous testing path forward. Ideally, this is an automated process that provides rapid feedback on every change.
Our Test Tooling
Powerful Tools Based on Years of Experience.
Xceptance Test Center - XTC
Scaling Projects Made Easy.
As a cloud-based service, Xceptance Test Center (XTC) provides a single interface for all your testing needs.
This commercial SaaS offering combines load and performance testing, monitoring, and test automation for both web applications and APIs, allowing you to handle everything from configuration to result analysis.
You can even continue to use existing assets such as your XLT load tests while benefiting from the added convenience XTC offers with its centralized control and access to comprehensive results.
Please learn more on our XTC product page.
Xceptance LoadTest - XLT
Flexible, Versatile, Trusted.
As dedicated load testing specialists, we created our own tool, Xceptance LoadTest (XLT) that is tailored to our needs. XLT is a premier load and performance testing tool designed for versatility and flexibility. It can handle everyday scenarios as well as extraordinary test challenges.
Key features include the ability to write tests in pure Java code, which can be run and debugged as JUnit tests directly in your preferred IDE. As an open-source tool under the Apache License, XLT ensures there is no vendor lock-in and no additional licence cost.
Learn more on our XLT product page.


Third-Party Mocking Service
Latency-Aware Emulation of Third-Party Services.
Testing with external services can be a challenge. Third-party services are often not performance-testing enabled and can impose strict usage restrictions or introduce performance bottlenecks. We can mock third-party services such as inventory services, tax calculators, address validation services and payment gateways, just to name a few. Our mocking service delivers a latency-aware, high-throughput emulation.
XCMailr - Email Service At Scale
Mailing For Tests At Scale.
Load testing often requires a large quantity of unique email addresses. Certain test scenarios, such as user registration or order confirmation, can also generate a significant volume of outbound emails. It is crucial that these email addresses genuinely exist and that emails are received by a real server.
Xceptance addresses this challenge by owning email domains and providing a specialized service, XCMailr, for receiving emails at scale during load testing. It also allows for email content evaluation, enabling scenarios like extracting coupon codes from emails or validating password recovery processes.
XCMailr is open source and can be found at GitHub.

Knowledge Counts
Learn More About Load and Performance Testing
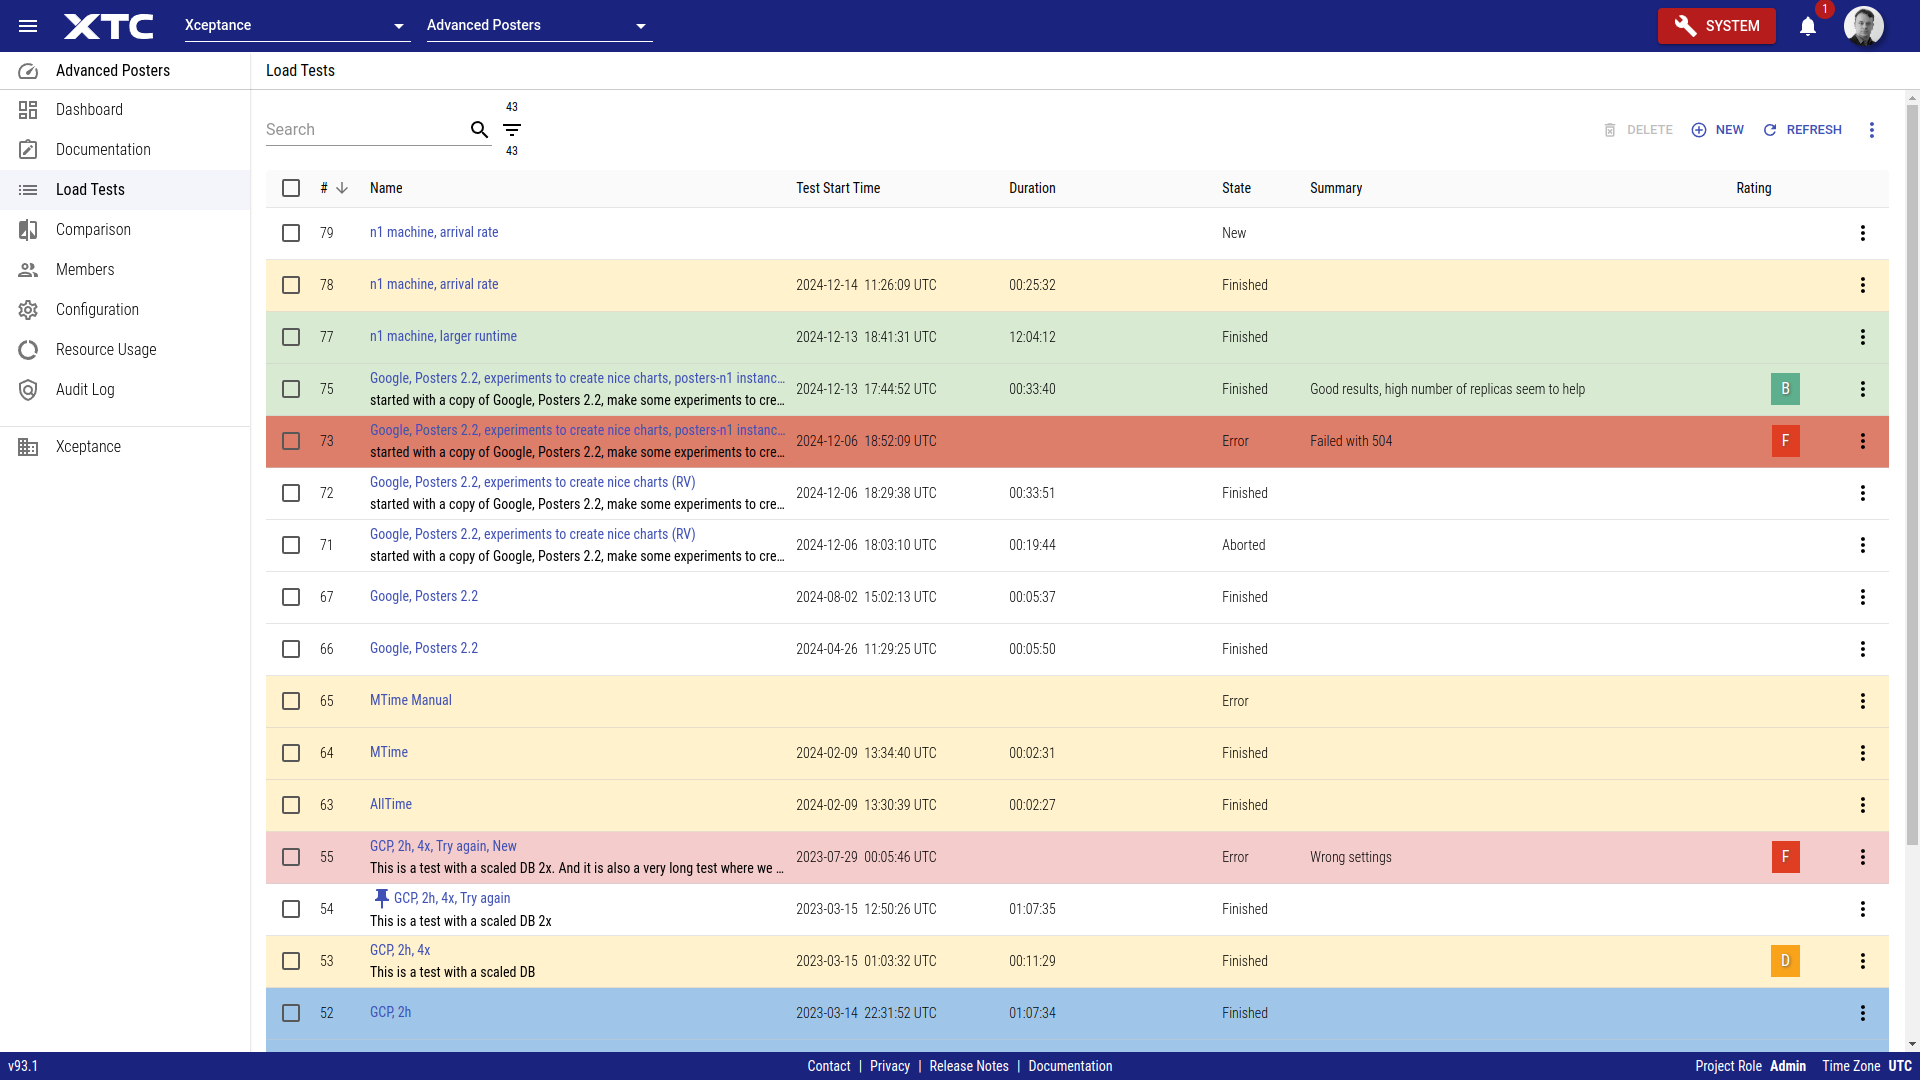
Performance Success Criteria
Interpreting the vast amount of data generated by load and performance testing can be complex. To provide clear, actionable insights for all stakeholders, Xceptance developed a unique Load Test Rating Scheme. This system simplifies complicated metrics into an easy-to-understand format.
Beyond detailed technical reports, we offer clear guidance by rating your load test results using an A+ to F grading scale, similar to the American education system.
So A+ to C represent excellent to satisfactory performance. The B grade indicates a good result, representing an average performance compared to similar customers and projects. If the results are rated D or F, some areas need to be significantly improved.
Our rating takes three critical factors into account:
- Response Times: How quickly your application responds to user requests
- Errors: The quantity and type of errors encountered during the test
- Predictability: The consistency of your application's performance under load
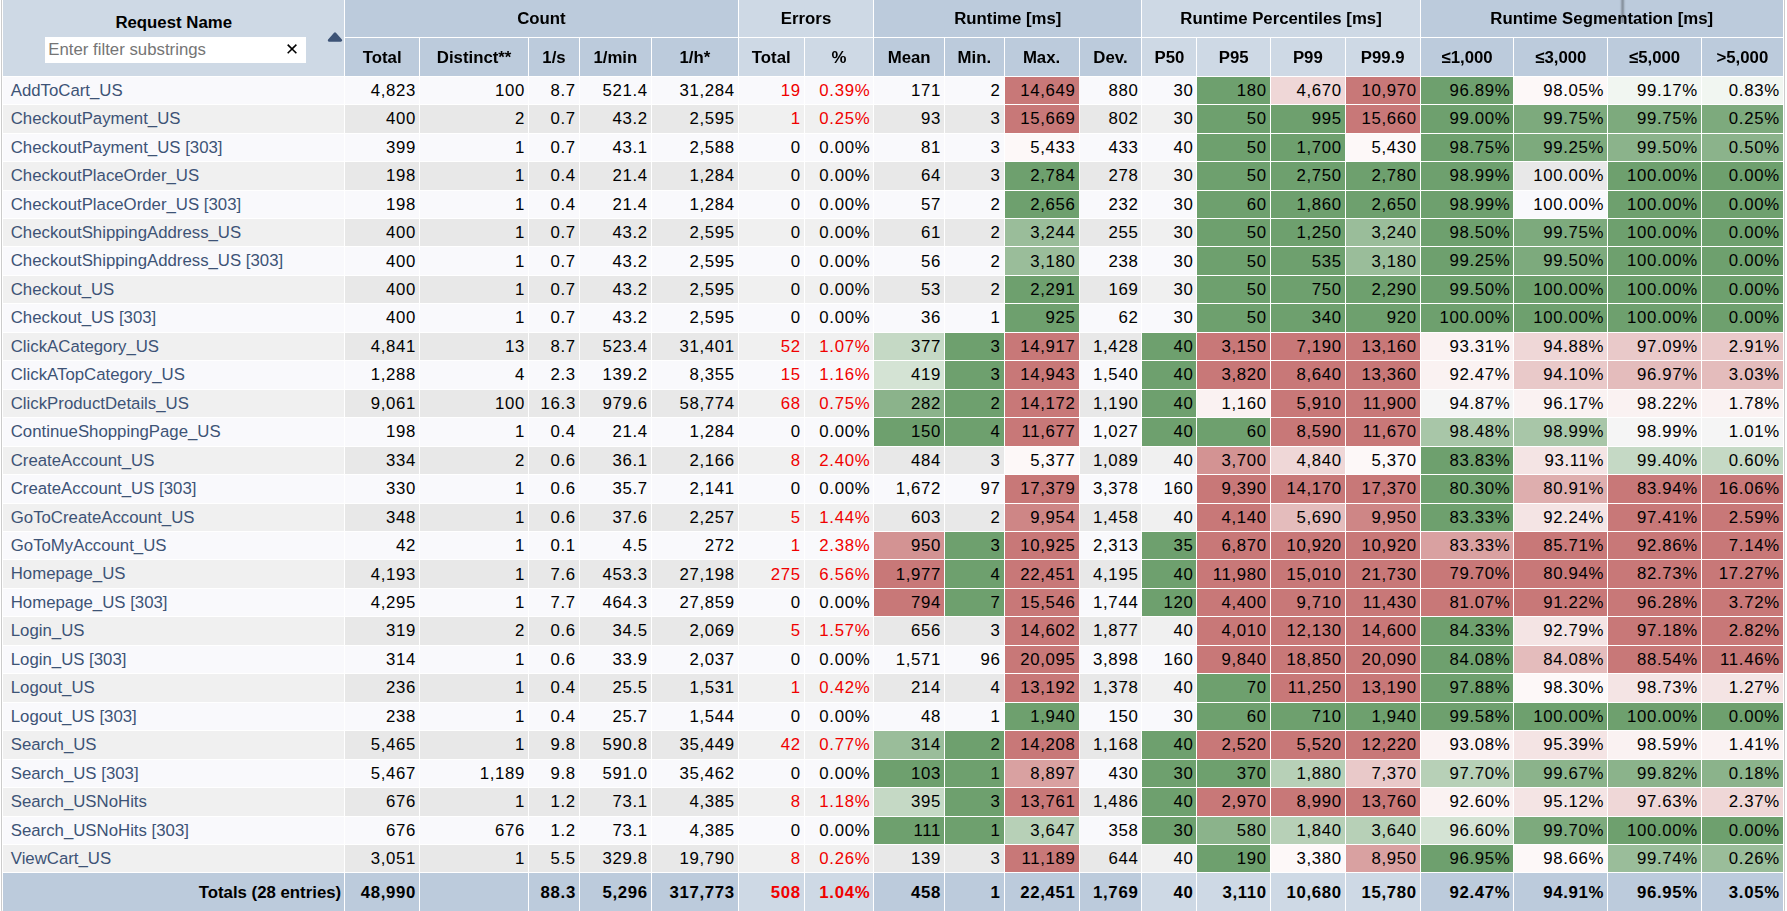
For accurate assessment, web application pages are grouped into categories (e.g., Homepage, Catalog, Checkout for e-commerce). Each group has specific response time, error, and predictability limits. The rating for a group is determined by the the worst value determined within this group, and the lowest group rating then determines the final overall grade.
For a detailed description of the rating criteria see our rating criteria blog article.

Server-Side-Performance
The goal is to test the timing behaviour, capacity, and scaling of both the infrastructure and the application code. This process focuses on the platform under test, primarily operating at the communication level, e.g., HTTP/S. It does not verify client activities like browser or device rendering. Resources delivered by CDNs (static content) and requests that are issued by the client-side to third-party services like analytics are typically excluded.
API performance tests also belong in this category, including:
- APIs within larger web architectures, such as Headless and Progressive Web Apps (PWAs)
- General web services
- REST-based APIs
Technically, server-side web application testing and "pure" API performance testing are quite similar, as both involve sending requests to one or more servers and evaluating the results.
The main distinction is in the approach. For web applications, we analyze the application and its client-server communication to create test scripts that replicate the unique logic of how the application builds URLs and retrieves data. For API testing, scripts are built by following the API's documentation and common use cases to simulate typical interaction patterns.
Please bear in mind that excellent server-side performance is a prerequisite for excellent client-side performance.
Server-side performance is often also called classic load testing. This involves specific tools that use load agent machines to simulate user and client-side application behaviour, issue requests against the platform under test, measure detailed results, and generate comprehensive reports.
Client-Side Performance
This is the actual performance of your web application in a browser, as perceived by your end users. A web page loads asynchronously, gathering, parsing, processing, and rendering various data from multiple requests.
While load tests (discussed above) measure the response times of these underlying requests, it is not possible to derive the exact time it takes for a real user to see a fully rendered web page in a real browser. This duration also depends on factors like the browser type, viewport size, client machine hardware, client-side JavaScript execution, and internet connection speed. It's even challenging to precisely define when a web page is considered "complete."
To accurately evaluate your client-side performance, we offer our Client-Side Performance Review. This is a tool-supported, comprehensive performance review of how your application renders in a browser.
We use established KPIs like Google Core Web Vitals and RAIL guidelines, measuring performance for both desktop and responsive designs, across Wi-Fi and Fast 3G connections.
Beyond measurement test results, our deliverables include valuable tuning and usability recommendations.
